
|
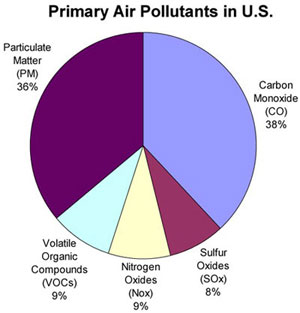
This is a pie chart showing the different factors that contribute to air pollution. Therefore, it is also showing what factors have the biggest carbon footprint and in turn need to try and reduce their carbon footprint. The leading source of air pollution is Industry accounting for 52% of the emissions of air pollution. The second leading source of air pollution is Transportation accounting for 27% of the emissions of air pollution. While Commercial and Residential Heating account for 1% of the emissions of air pollution which makes it least source of air pollution.
-Eric Price |
|
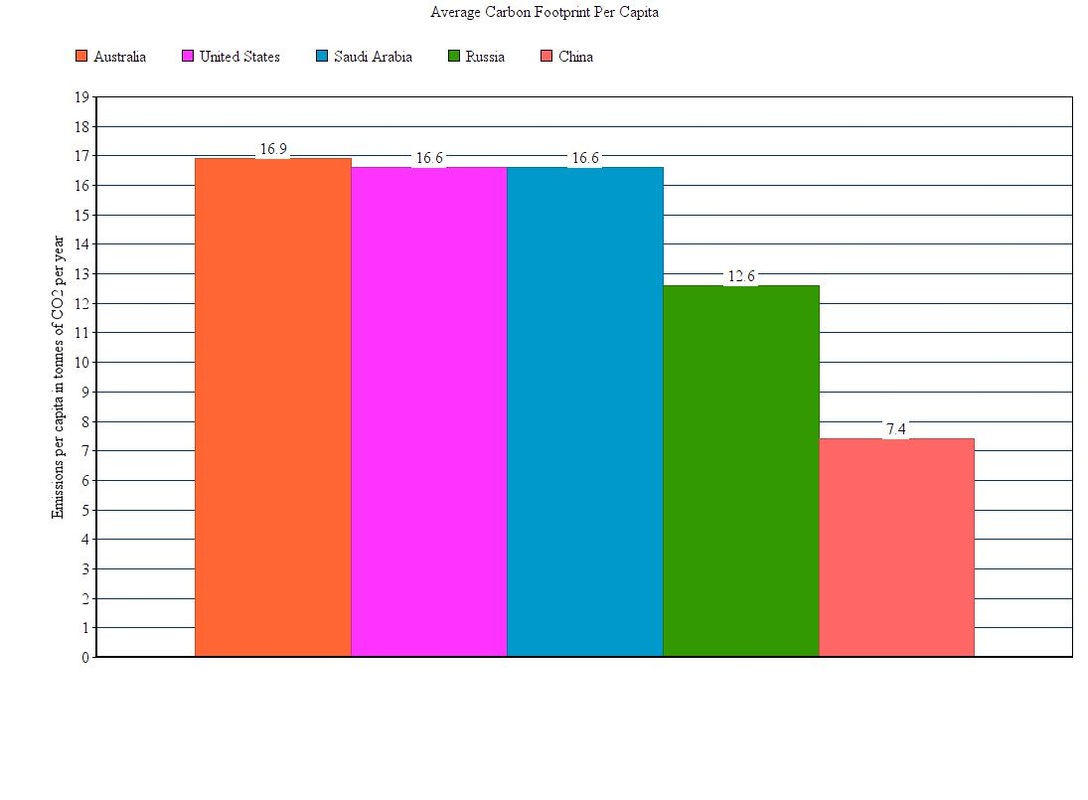
This bar graph shows the amount of emissions per capita in a few countries around the world. The U.S. is tied for second most emissions per capita at 16.6 tonnes per capita. This is the number we are trying to reduce. Even though China has an overall large amount of emissions they are efficient per person at only 7.4 tonnes per capita. The hope is that we can help make the U.S. a more efficient country.
-Ethan Bryan |
|
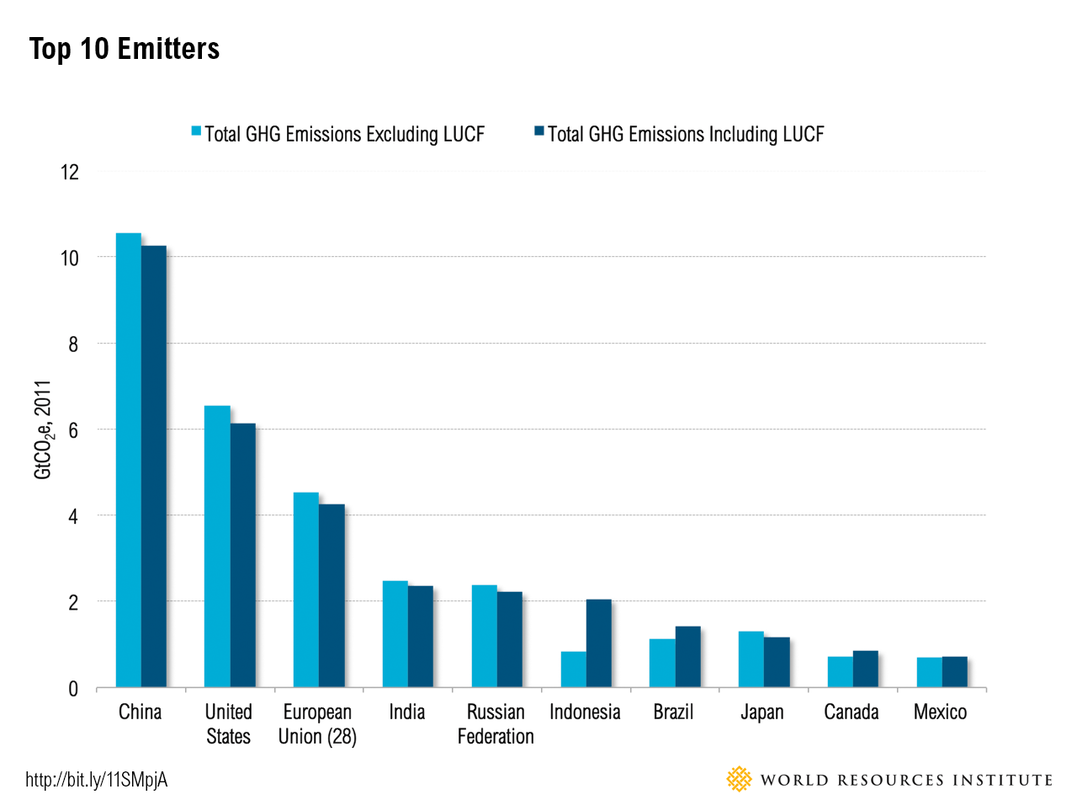
Top Ten Highest Carbon Footprint -This is a graph that shows the top ten highest emmissions from different countries. As you can see China has the highest emmissions because of its high population, but Mexico's is very low due to less cars and energy consumption. America is number two on the chart for highest emmissions which is why this is a big issue and needs to be noticed and solved soon before its too late.
-Teddy Dapprich |
|
This pie chart shows the main causes to air pollution in the United States. This chart shows that the main cause to air pollution is caused by Carbon Monoxide which is ranked 38%. Carbon monoxide is toxic to animals, which includes humans but only when it's concentrations are above about 35 ppm. Then the lowest cause is Sulfur Oxides which is ranked 8% in the United States. Sulfur Oxides are compounds of sulfur and oxygen molecules and is pre-dominant formed and is found in the lower atmosphere. I chose this pie chart because it shows the highest and lowest percentage of what causes air pollution in the United States. It shows what is causing it the most and if it's something people can help to fix.
-Hayley Horgrow |
